2008-03-17

Spectrum from Heavens

Hrošátka (group of my students) experimented with our new SGS spectrograph on last Thursday. It was of our first real contact with the device so any basic operation was hardly for us (arranging, focusing, pointing, exposing). We acquired a few spectra of some bright objects to test of our equipment. I see, we will need a lot of fine tuning and a lot of experiences in observation and data processing to get a day-to-day usable spectral apparatus. Also, I meet again with CCDops utility. It works nicely under Mac OS X, but it is still hardly to use.

All the spectra has been acquired on evening 2008-03-13 by SGS spectrograph in a low-dispersion configuration and mounted on Celestron 14" with ST-8 XME camera as a detector. All images has been processed by the same way as previous ones. The wavelength calibration is only preliminary.

A first object to acquire was the Moon. It is bright and easy to point. Moreover, the spectrum of the Moon is practically identical to the Sun's spectrum. The resultant spectrum shows a great peak of a continuum radiation modulated by some absorptions lines. The great peak practically visualise the spectral sensitivity of our CCD camera. There are only strong lines due to a non-perfect focusing.


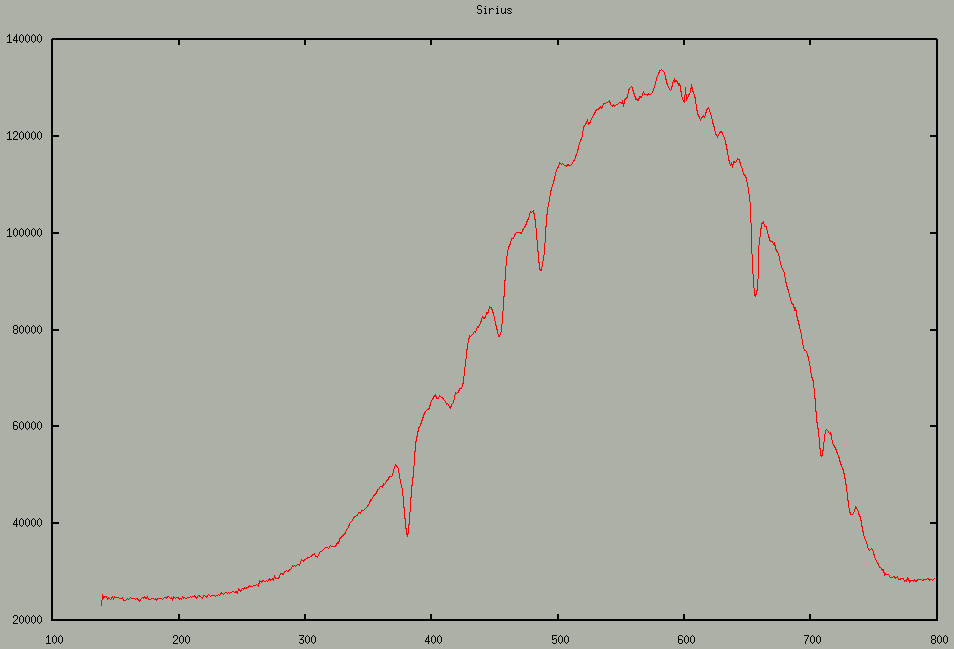
As second object, we acquired Sirius. Sirius is a hot star with spectral classification A0. The spectrum shows practically only strong hydrogen lines of the Balmer's series.


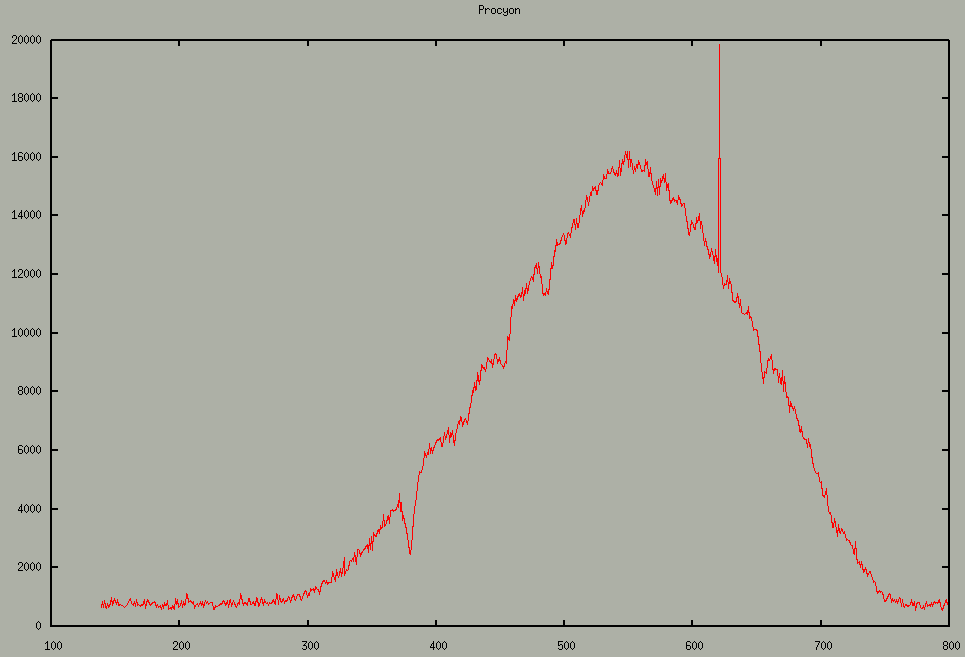
A little bit fainter star was Procyon of a spectral class F5. The hydrogen lines are suppressed and only marginal features are visible. I selected this spectrum as an illustration of an image of a spectrum on the CCD chip.


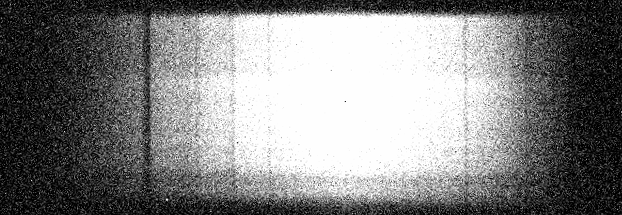
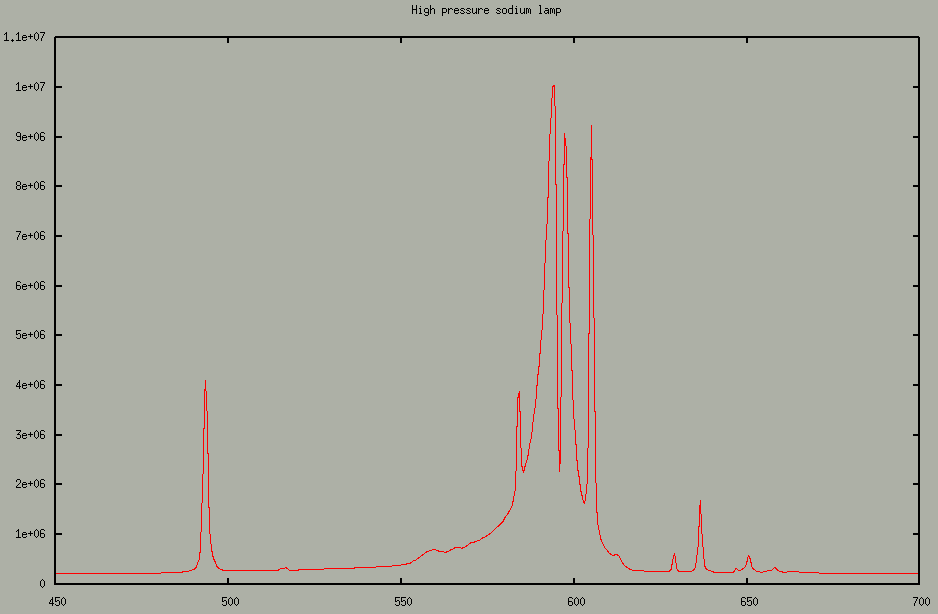
A high pressure sodium streetlamp has been tried as a possible calibration source. The spectrum is quite different due to a non-thermal mechanism of lighting. Unfortunately, the spectrum is included in all other specters as emission lines. The sky's spectrum is also practically identical. Note, that spectra by a Ch. Buil shows some differences.
Thx to my students Maceška, Kočka and Peťoš for a great help. Especially, Maceška bravery controlled of our notebook when she had a broken leg.

Update: Raw images of spectra are available on Petoš's blog.

2008-03-16

Leo I

One of twelve known companions of our Galaxy (Milky way) is a dwarf galaxy Leo I. The object is projected to a head of Leo constellation with look like a faint star cluster of an approximately dimension of five arcmins and with its total visual magnitude about ten. Leo I is 250 kpc far from us (Milky way has 30-40 kpc in diameter) so its linear dimension is quarter or half of kiloparsec(!). The estimated number of stars (with sun's mass) is 109 (Milky way contains about 1011 of stars). The galaxies like Leo I appertains to a class of dwarf spheroidal galaxies (dSph).

A relative proximity of this kind of galaxies enables us to study of various details not accessible for remote ones. Especially, it is possible to resolve of individual stars and to measure of its magnitudes and spectra. The measurements gives direct values of a dispersion velocity (The dispersion velocity can be determined by estimation of a width of a spectral line raised as a mean of velocity differences of individual stars. The value is greater for faster stars and doesn't depends on a relative velocity of a galaxy's center of gravity.). Velocity measurements are a tool to mapping of the gravitational potential. If any outer fields are negligible, the potential is formed by a distribution of stars. It is worse that the distribution of stars is formed by potential. Fortunately, the simultaneous fitting of both quantities gives right results. But there is problem with observed discrepancy between number of stars (the projected surface luminosity) at a some radius from a core and the dispersion velocity at the same place. That is widely known problem of "dark matter" because the velocity is greater than we are expecting from observations of number of stars with an usual luminosity.

Only for my interest, I made an observation of Leo I on MonteBoo Observatory. A resultant image has been acquired by composition of a series of images at 2008-03-06 between 19:51 and 22:15 UT (totally 5160 sec) by our 0.6m telescope at R band. The Leo I itself is situated to the center of the image as a faint stellar cluster (compare with image of D. Malin on APOD). A graph by a paper Walker et al.(2007) (it contains recent measurements of the dispersion velocities for seven dSphs) is placed to the image. The original graph is scaled to match of the position and the angular scale of Leo I. The solid line fits the measured velocity dispersions in km/s. The horizontal axis represents a distance from its center in parsec (the range is: 0 to 2kpc). The hashed line is a King's model for the luminosity which roughly corresponds to density of stars in the image. For better description, read the original paper. The discrepancy between the luminosity and the velocity is clearly visible. The velocity is a constant at radius where the density of stars is relative low. Note, that potential (velocity) falls rapidly when no matter is presented.

Moreover, the image exhibits a lot of defects over Leo I itself. "Stairs" at edge of the image together with white corners demonstrates a pointing mode of the telescope during a long time series. The effect is intensified by correcting of the image for its median. The median also suppresses a light pollution due to an unidentified near light source. The pollution creates a fan of rays at bottom of image.

2008-03-13

Kotvrdovice's airport

My Sunday's afternoon trip to Moravian Karst finished on Kotvrdovice's airport. The airport is covered by grass plot except a small part of concrete and perhaps it's an airport for sports planes. A horizon is near of ideal but the concrete surface is in proximity of Kotvrdovice (and public lighting) itself. The airport is about two kilometers from Kojál transmiter.

Kotvrdovice's airport facility and runway.

View to Kojál.

2008-03-09

Archive of our observations

Four years ago, I wrote a really simple database engine for our observations. The data are indexed one per day and stored in a database (sqlite, more sophisticated engines need a server) and the served via at the most simple web interface. This philosophy satisfy all our needs so there is no reason for a change.

Now, I'm moving our old software to a new computer so I made a small improvement to database by adding of a new Reference column to front (year) page. It provide a possibility to back-linking of some results to the original data.

The data archive has a link in my links.